
TL;DR: I used Grafana Helm charts and ArgoCD to deploy dashboards as code.
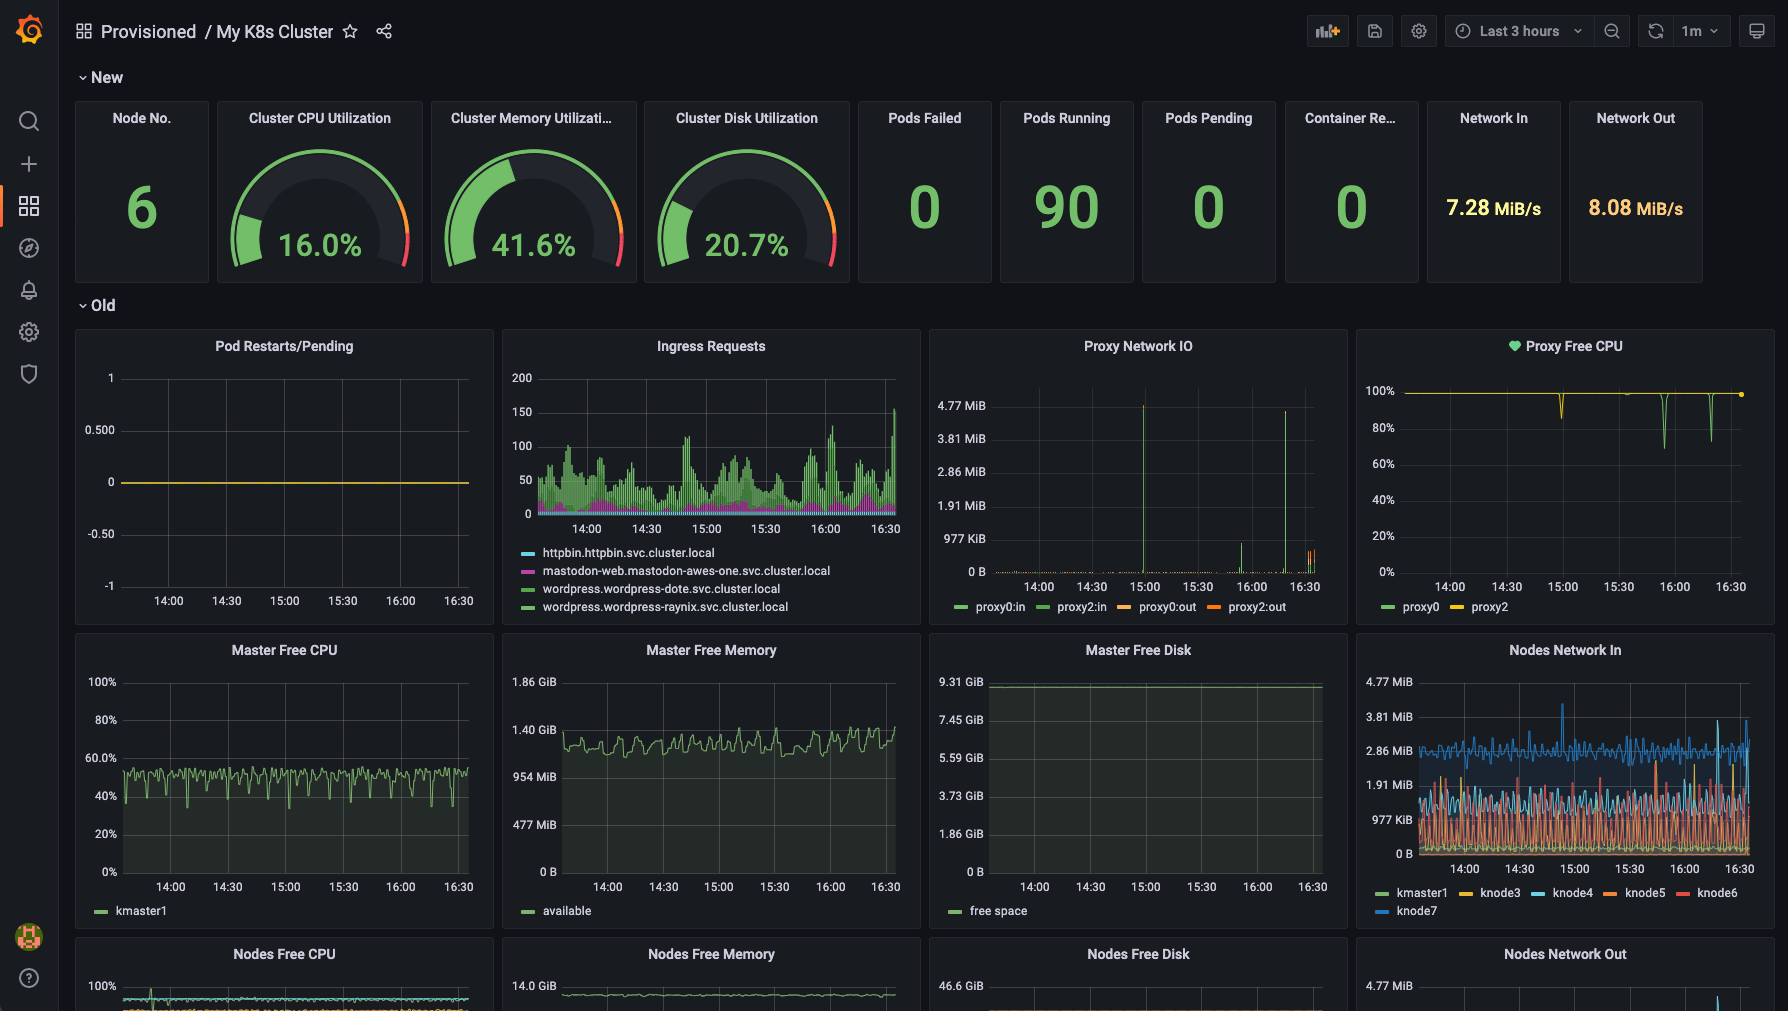
I’ve been using Grafana to build dashboards for years, both at work and as a hobby. A dashboard was created by hand for monitoring my garage Kubernetes cluster. Since I’ve adopted gitOps with ArgoCD a few years ago, what about going forward and putting monitoring as code too?
I thought that I could craft some sidecar container which will gather dashboard JSON files and import them on-the-fly. But when I took a closer look at Grafana’s Helm chart, someone has implemented ‘my idea’ already. So, with this Helm chart I only need the following values to activate the monitoring as code feature:
sidecar:
  dashboards:
    enabled: true
    # any files in ConfigMap with this label will be loaded
    # as a dashboard
    label: grafana_dashboard
    folder: /tmp/dashboards
    provider:
      name: sidecarProvider
      orgid: 1
      # the folder name in Grafana
      folder: Provisioned
      type: file
Then I used kustomize to generate ConfigMaps easily:
apiVersion: kustomize.config.k8s.io/v1beta1
kind: Kustomization

configMapGenerator:
  - name: dashboards
    namespace: grafana
    options:
      labels:
        grafana_dashboard: 'yes'
    files:
      # note: k8s ConfigMap can only hold 1MB, so use 1 JSON per
      # ConfigMap if the dashboard is big
      - dashboard-test.json
      - dashboard-k8s.json
A full ArgoCD app for this exercise is here.
🙂