-
Monitoring as Code with Grafana

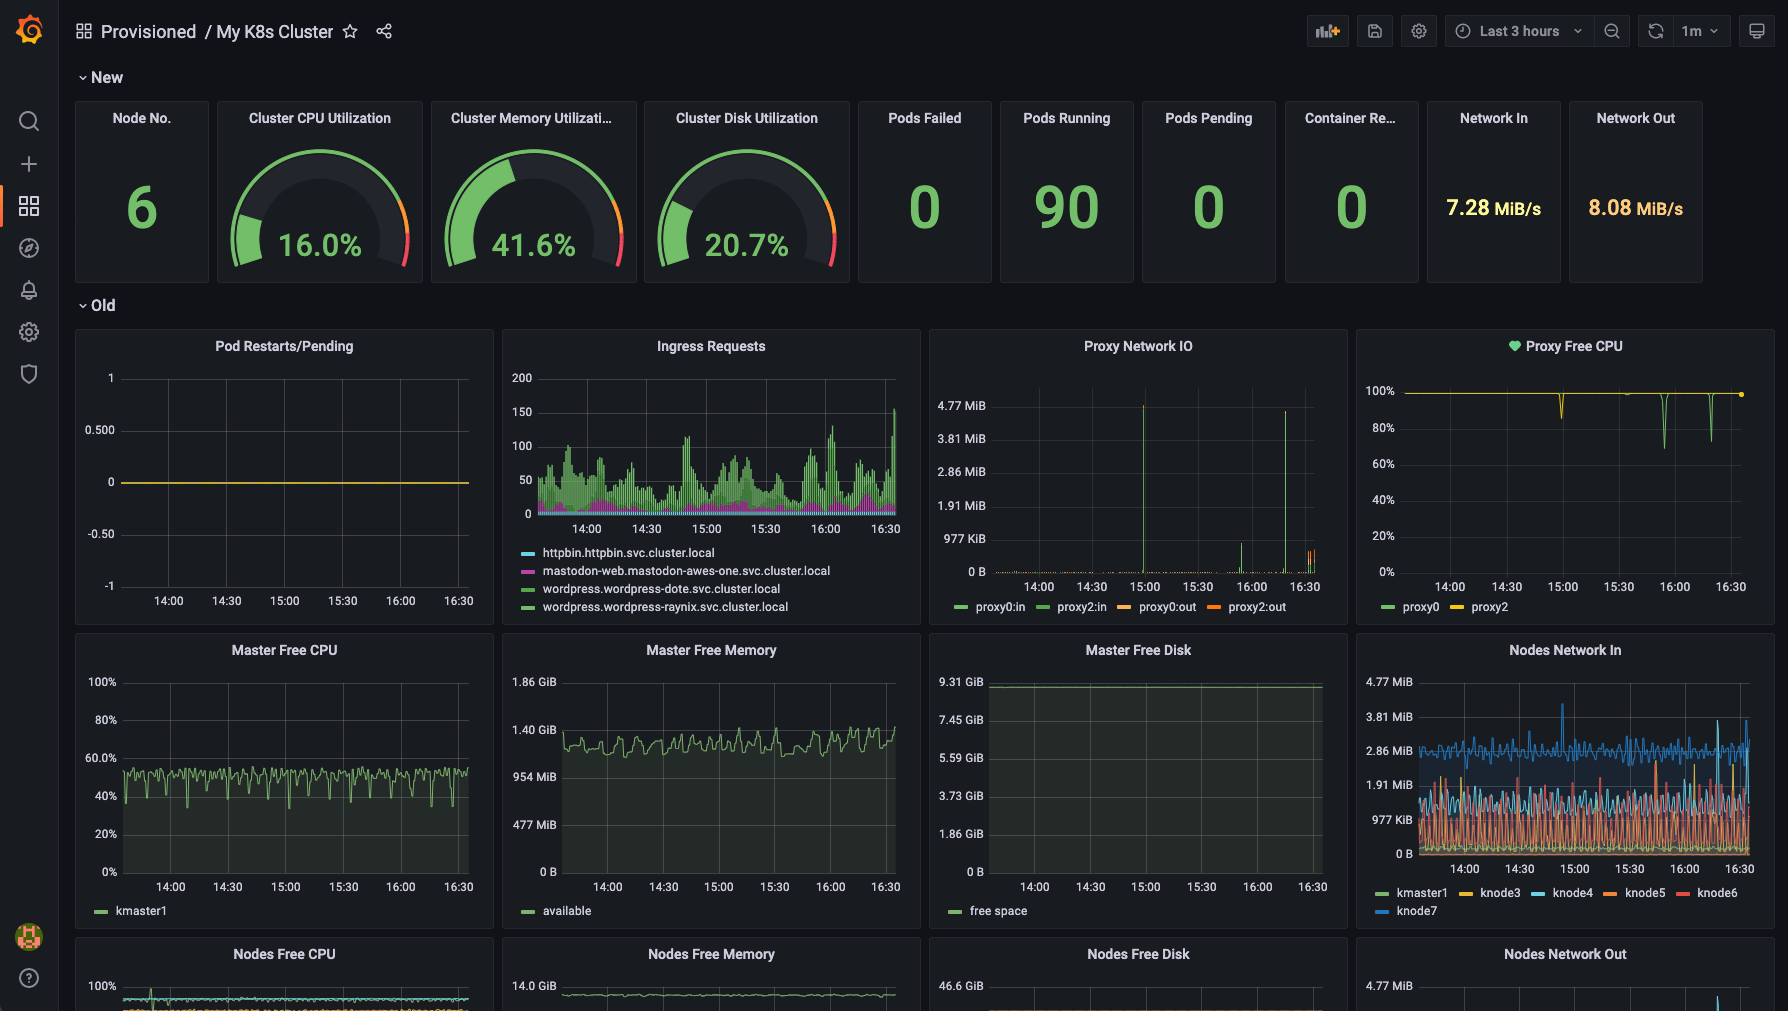
TL;DR: I used Grafana Helm charts and ArgoCD to deploy dashboards as code. I’ve been using Grafana to build dashboards for years, both at work and as a hobby. A dashboard was created by hand for monitoring my garage Kubernetes cluster. Since I’ve adopted gitOps with ArgoCD a few years ago, what about going forward…
-
Deploy the Loki Stack in a Kubernetes Cluster with ArgoCD
Loki and Promtail from Grafana Labs are new kids in the observability community. Are they good enough to replace Elasticsearch and Logstash? I would like to see. Here’s a sample ArgoCD Application to deploy Loki, Promtail, Prometheus and Grafana all from 1 Helm chart: grafana/loki-stack. Some settings of my installations are: loki, grafana and prometheus…
-
Adding Annotation to Grafana Dashboards, with InfluxDB
It’s very easy to add this super powerful annotations to Grafana charts. I followed the below instructions and created my first annotation in a few minutes on an existing Grafana + InfluxDB setup. https://maxchadwick.xyz/blog/grafana-influxdb-annotations 🙂
